

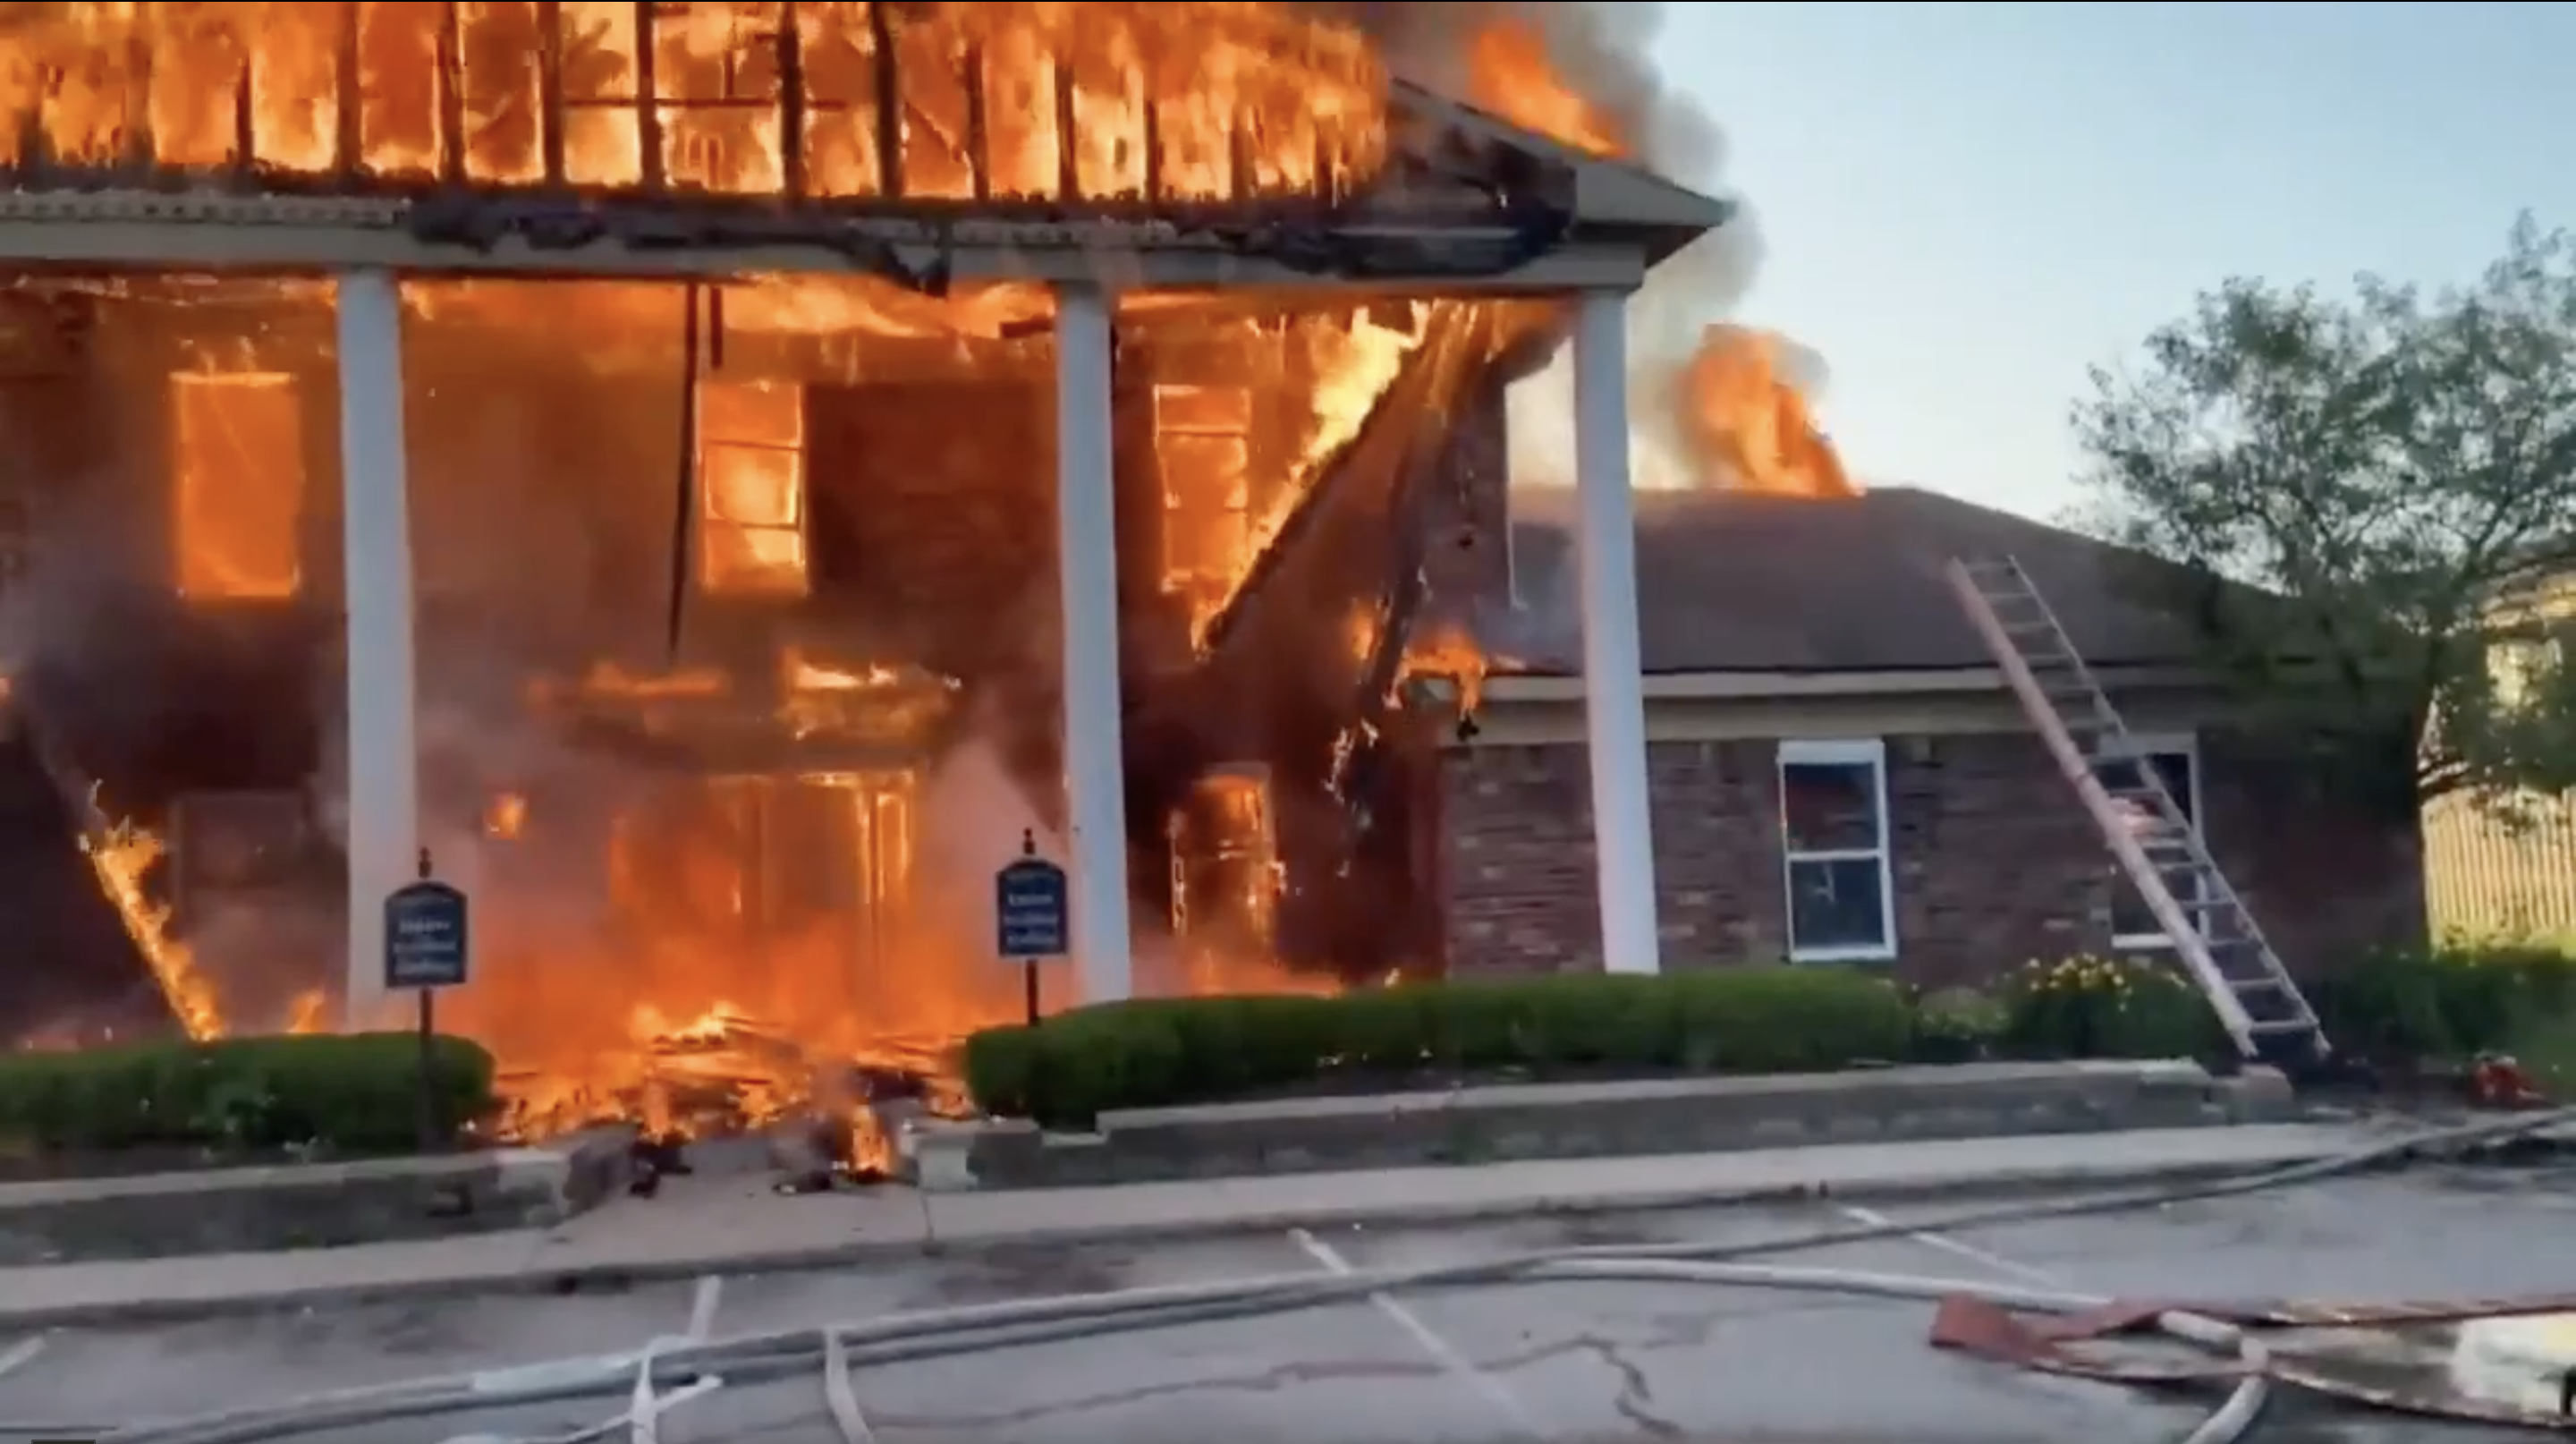
The Indianapolis Fire Department (IFD) had a problem. Between September 2020 and the end of November 2021, the Lakeside Pointe at Nora apartment complex suffered ten working building fires. The clubhouse had sustained a total loss in June (seen above), and apartment fires became more frequent as winter approached. The facility owners faced lawsuits from the state and city regarding multiple unaddressed safety and health violations, some dating back several years. In addition to the fires, the demand for other IFD services was exceptionally high.
Mayor Joe Hogsett reached his breaking point and called all hands on deck to address these issues. For IFD’s part, the Community Risk Reduction Bureau’s (CRR) Fire and Life Safety Division (FLSD), under the leadership of Deputy Chief Matt Henss and Fire Marshal Michael Beard, began pouring over incident data and interviewing Lakeside residents to identify trends, service gaps, and opportunities for improvement. The findings led to smoke alarm blitzes, targeted safety and health education, and improved code enforcement. Captains Aleatha Henderson (Director of Public Education – since promoted to Battalion Chief) and Steve Rowland (Assistant Fire Marshal – since promoted to Battalion Chief) worked with Battalion Chief Trevor Hanshew (Fire Investigations Unit) on efforts that reduced Lakeside Pointe’s incident volume by 75% over the next six months. In fact, there was only one fire-related incident (an alarm investigation) during that period.
Heartened by the phenomenal results, the FLSD wondered if they could scale a similar approach across each of the service area’s neighborhoods. They decided to expand their focus to include demographic and socio-economic data. Their three-headed method of utilizing census data, historical incident reports, and local anecdotes would allow the FLSD to project future needs, respond to current issues, and “see” beyond the data. The research results would then produce a neighborhood risk rating, allowing the division to deploy its resources where they were most needed.
The first step was to establish the list of neighborhoods. Depending on the definition and approach, Indianapolis has between 12 and 300 neighborhoods. The FLSD debated the merits and challenges of utilizing comprehensive and highly granular perspectives. As part of this research, they identified the different neighborhood map layers available through ESRI ArcGIS. The decision was made to move forward with a layer displaying 72 neighborhoods, splitting the difference between too broad and too many.
With the neighborhoods defined, the following steps were to collect census and incident data. Working with the Planning Division’s Captain Michael Tiernan (ISO and Accreditation Manager – since promoted to Battalion Chief), FLSD Program Manager Ar’Cheya Davis dove into the US Census data. She used the IUPUI Polis Center’s Social Assets and Vulnerabilities Index (SAVI) website to pull over 60 data points by neighborhood. Tiernan captured the incident data by mapping fire and EMS incidents over the neighborhood layer and exporting the totals for each incident class by neighborhood.
Davis reduced the census information to six categories: poverty rates, unemployment rates, vacancy rates, property crime rates, violent crime rates, and life expectancy. Fire and EMS incident rates were considered separately. She then ranked each of the 72 neighborhoods across each of these categories. The neighborhoods with the highest risk in each category received higher rank scores (1 = highest risk, 72 = lowest risk). The rank scores across all eight categories were then combined and used to provide the final neighborhood risk scores (again, the lower numeric scores correlated to the highest risk levels). These scores were used to assign each neighborhood an overall risk category (high, moderate, low). In the end, 13 neighborhoods were deemed to be high-risk (risk scores between 42-115), 49 were scored as moderate-risk (risk scores 120-348), and ten were assigned a low-risk categorization (risk scores between 357-381).
Armed with this knowledge, Beard and his team decided to first concentrate on the six highest-risk neighborhoods (they were initially going to focus on the top five but were surprised to see Downtown sneak in at #3 due to its high crime and incident rates). Henderson and Davis began contacting the neighborhood organizations and contacts at the Mayor’s Neighborhood Advocates office to schedule meetings. At these meetings, the FLSD shared their findings and impressions of the community’s needs and listened for feedback regarding the residents’ daily experiences and concerns. This bilateral conversation helped the department to understand better the community’s desires and aided the community in learning about the services IFD provides.
Today, the FLSD is comparing its existing programs to the needs identified through its community outreach. The current programs will quickly be implemented when there is a match. When there is a gap, the FLSD will first look for external programs and partners that could fill the need. If none can be found, new programs will be created to meet the needs of multiple neighborhoods and leverage potential and existing external partnerships.
The department’s methodology for risk-driven neighborhood outreach is still being written. The plan is to adopt a cycle mirroring NFPA 1730’s approach to fire safety inspections. Programs will be delivered to high-risk neighborhoods every year, moderate-risk neighborhoods every two years, and low-risk neighborhoods every three years. It is important to note that many programs delivered in one neighborhood will bleed over into the surrounding areas. Hence, the likelihood of an area going three years without receiving any outreach is extremely low.
A vital component of this methodology will be the ongoing assessment of the community and program effectiveness. The baselines have already been established, and benchmarks should be created before a new program is rolled out. Continuous assessment is needed to ensure the prescriptions have their intended effect and unknown risks in the community are being identified.
This approach will continue to evolve. The collected data points will likely see some changes and consolidations, and a weighted scoring system will likely be implemented one day. Decisions must also be made about when environmental scans are performed and whether they will be comprehensive or risk-level/neighborhood specific. The most daunting challenge will be building a schedule where multiple programs are being delivered in various city areas by an extremely lean CRR staff.
This development is very exciting. While these plans may seem rudimentary compared to the groundbreaking work performed in communities like Charlottesville and Myrtle Beach, they have been years in the making for IFD. Thanks to the hard work of the entire FLSD team, the vision is becoming a reality. Chief Rowland’s building risk matrix (proprietary OVAP) and Chief Hendersons’s risk-based neighborhood outreach program create synergy between the department’s community risk reduction and operations efforts. While both chiefs will be retiring mid-year after more than a decade of service in their current roles, they are leaving a legacy that will continue to pay dividends for our community and department members.
